

Quantification of VOCs Using Ion Mobility Spectrometry (IMS)
The process of quantifying volatile organic compounds (VOCs) using Ion Mobility Spectrometry (IMS) extends beyond their mere identification. It involves understanding the relationship between the VOCs’ concentration and the signal detected at the Faraday plate. However, this relationship is influenced by various factors, including kinetics and thermodynamics, making the quantification process complex.
Challenges in VOC Quantification via IMS
One of the primary challenges in IMS-based VOC quantification is ion clustering within the drift tube, which can significantly impact the sensitivity of the IMS system. Ion clustering occurs when molecules form aggregates due to intermolecular forces, leading to shifts in the drift time of the analyte and potential inaccuracies in concentration measurements.
Additionally, IMS faces limitations in analyzing high-concentration compounds. This is due to the saturation of the ionization source and the depletion of reactant ions, which results in decreased signal strength at higher concentrations. IMS devices that utilize radioactive ionization sources, such as nickel-based sources, exhibit a linear relationship between concentration and signal intensity only at very low levels—typically in the nanogram or parts per billion (ppb) range. However, as the concentration increases, the calibration curve reaches a plateau, which restricts the range of quantifiable concentrations. This plateau behavior leads to a logarithmic response instead of a linear one, further complicating accurate quantification at higher concentrations.
Feasibility of Quantitative Analysis for Breath-Based VOC Detection
Despite these challenges, IMS remains a valuable tool for detecting VOCs in breath samples, primarily because the VOCs present in human breath are typically found at low concentrations. Since IMS provides optimal sensitivity for detecting low-level VOCs, it becomes a practical method for quantitative breath analysis. This enables the setup of alarm thresholds for specific conditions, such as High-Altitude Pulmonary Edema (HAPE), by identifying the presence of characteristic VOC markers.
VOCs as Biomarkers for Disease Detection
Among the VOCs frequently reported in medical diagnostics, alkyl aldehydes are notable markers for lung cancer. These aldehydes are programmed into the IMS instrument for detection in the positive ion mode. By detecting specific VOCs in breath samples, IMS can serve as a non-invasive diagnostic tool, helping in the early detection of diseases such as lung cancer and respiratory conditions like HAPE.
In conclusion, while IMS has inherent limitations in quantifying high-concentration VOCs due to ion clustering and ionization source saturation, it remains a highly effective technique for low-concentration analysis. Its application in breath analysis for disease detection highlights its potential as a rapid and non-invasive diagnostic method.
Explanation of Alkyl Aldehyde (C8H16O) Detection and Calibration in Breath Analysis
The process of detecting alkyl aldehyde (C8H16O), a volatile organic compound (VOC) used as a lung cancer biomarker, using Ion Mobility Spectrometry (IMS). The reaction mechanism involves an ion-molecule reaction where the aldehyde interacts with an ammonia-water reagent ion, leading to ionized aldehyde formation:
This ionization process enhances the detectability of the aldehyde in breath samples.
Sensitivity and Calibration
• The IMS system’s sensitivity allows detection of aldehyde concentrations in the low nanogram range on a sample card mesh, making it suitable for breath analysis.
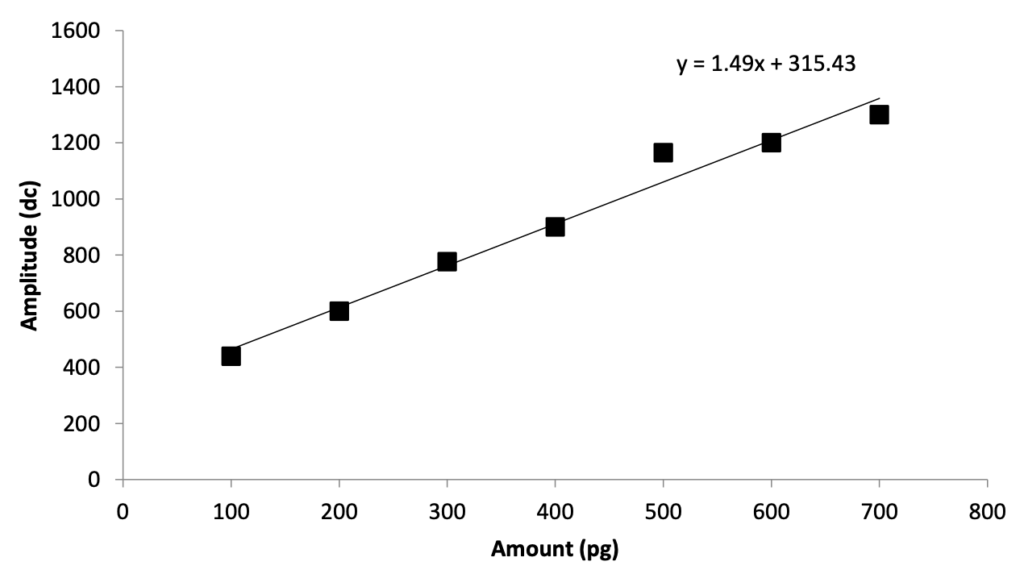
• The calibration curve in below figure demonstrates the relationship between the amount of aldehyde (pg) and the signal amplitude (digital counts, dc). The linear equation y = 1.49x + 315.43 indicates a direct relationship between aldehyde concentration and IMS response.
Explanation of the Graph Alkyl Aldehyde C8H16O
The graph in above figure represents the calibration curve for detecting alkyl aldehyde (C8H16O) using Ion Mobility Spectrometry (IMS).
Axes Explanation
• X-axis (Amount in picograms, pg): This represents the quantity of alkyl aldehyde deposited onto the sample mesh. The range goes from 0 to 800 pg.
• Y-axis (Amplitude in digital counts, dc): This represents the signal response (intensity) detected by the IMS instrument. Higher amplitude means a stronger detection signal. The range is from 0 to 1600 dc.
Key Observations from the Graph
1. Linear Relationship: The data points form a straight line, indicating that as the aldehyde amount increases, the IMS response increases proportionally.
2. Regression Equation:
• Slope (1.49): For every 1 pg increase in aldehyde, the signal amplitude increases by 1.49 digital counts.
• Intercept (315.43): Even at 0 pg, the baseline signal is around 315 digital counts, likely due to background noise or residual ionization effects.
3. Detection Sensitivity:
• The IMS system can detect aldehyde at very low concentrations (picogram level).
• The calibration curve confirms that low concentrations in breath (ppb to ppt levels) fall within the linear range of the detector, making quantification reliable.
Conclusion
• The graph demonstrates that IMS provides a linear and sensitive response for alkyl aldehyde detection.
• This supports its use in breath analysis for detecting lung cancer markers at trace levels.
• The established linearity ensures accurate quantification, making it a potential non-invasive diagnostic tool.
Relevance to Breath Analysis
• The typical aldehyde concentration in human breath falls within the low parts per billion (ppb) to high parts per trillion (ppt) range.
• This concentration level falls within the linear range of the detector, meaning IMS can effectively quantify aldehyde levels in breath samples for lung cancer screening.
Application to Tuberculosis VOC Detection
• A similar approach was used in another study to detect tuberculosis VOCs by preparing a VOC mixture in methanol and testing it using IMS in the field.
• 1 microliter of the sample was injected onto the detection card, analyzed using the AACTS-3000 IMS instrument, and the results were visualized in a 3D plot (shown in below figure).
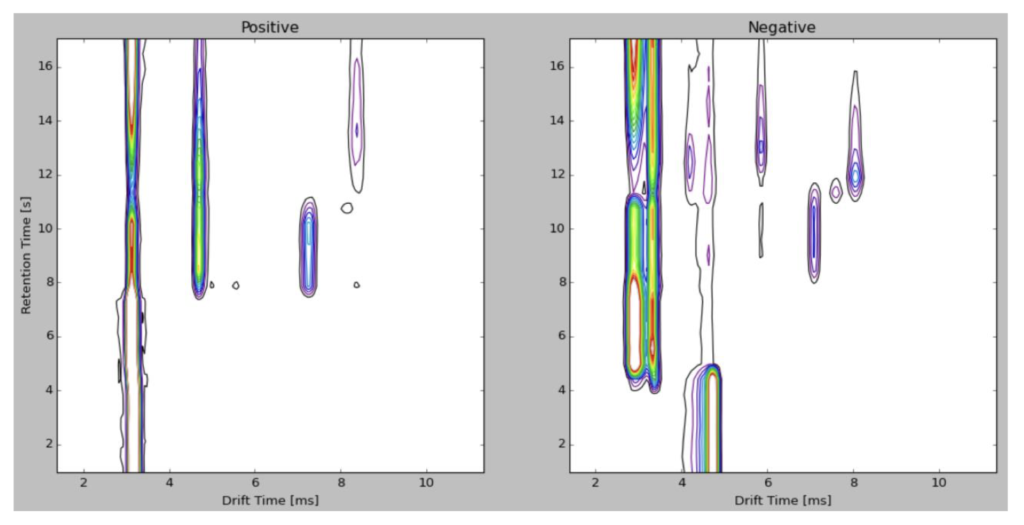
TB VOCs Mixture Solution in Positive and Negative Ion Spectrum
1. Understanding the Image above Figure
• This figure represents Ion Mobility Spectrometry (IMS) analysis of Tuberculosis (TB)-related Volatile Organic Compounds (VOCs).
• It shows two ion spectra:
• Positive Ion Spectrum (Left Panel): VOCs detected in positive ion mode.
• Negative Ion Spectrum (Right Panel): VOCs detected in negative ion mode.
• The X-axis represents Drift Time (ms) (how long it takes ions to travel through the drift tube).
• The Y-axis represents Retention Time (s) (how long compounds stay in the chromatography phase before entering the IMS).
• The colored regions indicate the presence and intensity of detected VOCs.
2. Key Points from the Text
Specificity of the Method
• IMS uses chemical ionization to detect individual VOCs in both positive and negative ionization modes.
• The multi-peak detection algorithm and pattern recognition help identify VOCs linked to specific diseases.
• The technique enhances the specificity of disease detection by distinguishing different compounds.
Method Repeatability
• A Sartorius digital pipette was used to deliver 0.1 µL of a 1 ng/µL aldehyde solution for repeatability testing.
• The method showed 5% Relative Standard Deviation (RSD), indicating good precision.
• VOCs have a threshold alarm level to trigger alerts when concentrations exceed preset limits.
• The alarm level can be adjusted for different environments (field testing, hospitals, laboratories) to minimize false positives due to background VOCs.
Conclusion
• The AACTS-3000 IMS instrument demonstrated high sensitivity for detecting VOCs at low concentrations.
• The system is promising for non-invasive breath analysis to identify VOC biomarkers for lung cancer and TB detection.
• Further validation in hospitals and testing facilities is necessary to confirm accuracy.
• Clinical trials would involve comparing breath samples from lung cancer and TB patients to healthy individuals.

Leave a Reply